Course Details

Data Analysis and Visualization with Microsoft Power BI
Course Synopsis
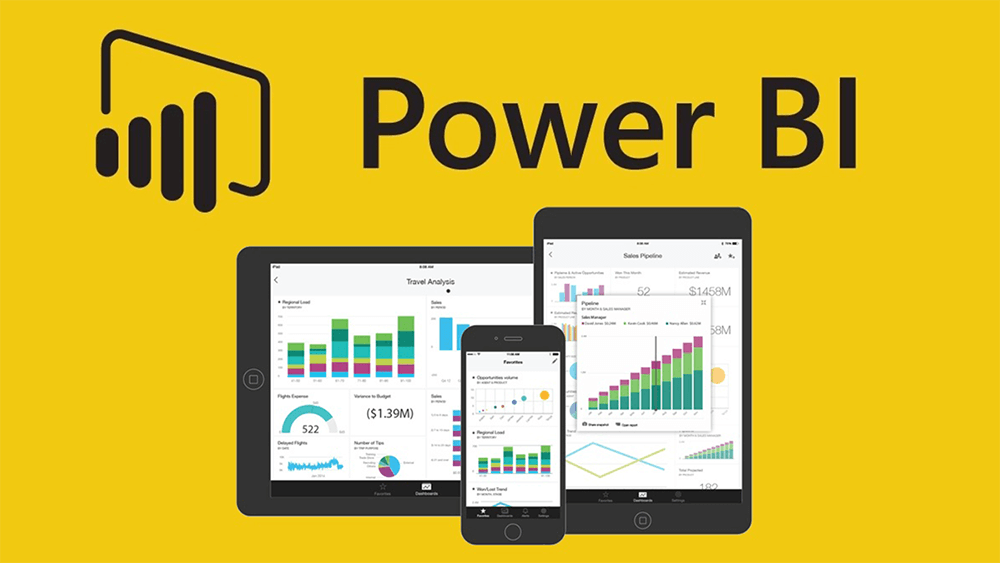
Data Analysis and Visualization with Microsoft Power BI is a comprehensive 60-hour training program designed to build proficiency in using Power BI for insightful and interactive data analytics. Power BI is an affordable, user-friendly business intelligence tool that simplifies the data analysis process. It empowers users to connect to various data sources, transform raw data, and create visually compelling dashboards and reports. The course requires no prior coding knowledge—though basic SQL can be helpful for data connections—and is ideal for professionals and students alike seeking practical, hands-on data analysis skills.
Required Textbooks
Brett Powell, Mastering Microsoft Power BI, Packt.
Roger F. Silva, Power BI: Create and Learn, Business Intelligence Clinic.
Completion Criteria
A student will be considered to have successfully completed the module upon fulfilling all the following conditions:
Minimum 90% attendance in all scheduled classes.
An average grade of 80% or higher on all assignments.
An average of 60% or higher in formal assessments.
Positive evaluation from the tutor confirming the student has grasped key concepts and is ready for the next level.
Prerequisites
A basic understanding of mathematics and logical thinking.
A willingness to commit at least 10 hours per week to learning, including hands-on practice.
Familiarity with Microsoft Excel and basic database concepts is beneficial.
Most importantly, a strong desire to learn and apply data analysis skills.


